Dashboards and Custom Charts
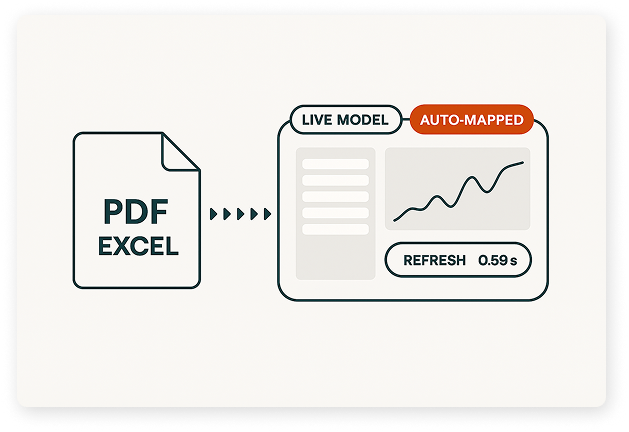
Turn your model into clear, visual insights. Explore dashboards, build custom charts, and understand performance instantly - without exporting to spreadsheets or BI tools.
Watch: Build Dashboards in Minutes
Follow these steps to view live dashboards, build charts from any series, and customise layouts to highlight what matters.
Step 1: Explore Dashboards
Step 2: Build Custom Charts
Step 3: Save Your Layout
See the Difference Instantly
Before Model Reef, understanding performance meant exporting data into spreadsheets or BI tools. Now dashboards and charts come built-in - live, connected and always in sync with your model.
| Task | Before Model Reef | After Model Reef |
|---|---|---|
| View Dashboards | Static exports | Live visuals |
| Build Charts | Manual plotting | One-click charting |
| Compare Trends | Rebuilding views | Dynamic, synced charts |
Your model becomes a visual storytelling tool instantly.
Insights That Appear Instantly
Model Reef turns your assumptions and performance into clear, interactive visuals - helping you communicate, compare and understand results at a glance.

Clarity in decisions
See performance, cashflow and KPIs with no setup or exports.
Accuracy you can trust
Dashboards stay synced with your model - no stale data.
Speed that saves hours
Build charts instantly from any series in the model.
Experience dashboards that stay live and accurate.
Keep Learning, Keep Exploring
Every tutorial builds on the last - helping you understand how structure, drivers, variables and visual outputs all connect into one modelling system. Each new skill helps you communicate insights more clearly and explore performance from every angle.
Explore the Features Behind This Workflow
Model Reef gives you powerful tools to visualise and communicate performance - all in one connected environment.
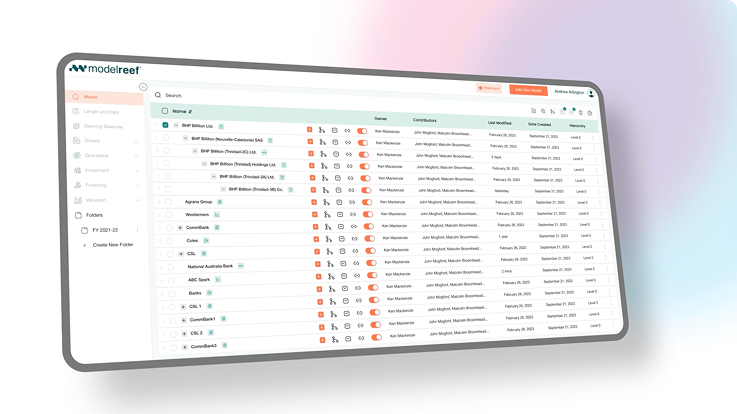
Interactive Dashboards
View financial performance at a glance with live updating visuals.
Driver-Based Modelling
Charts stay tied to the assumptions and drivers powering your model.
Real-Time Scenario Analysis
See how dashboards change instantly under new assumptions.
Real-Time Collaboration
Share dashboards and collaborate directly inside your model.
See all features that turn your model into insight.
Ready to Visualise Your Model?
Start your free 14-day trial and build dashboards that reveal insights instantly - no spreadsheets, no BI tools, no manual exports.
Want to explore more? Compare plans